Plots an ordination of latent variables and their corresponding coefficients (biplot).
plot.cord.RdPlots an ordination of latent variables and their corresponding coefficients (biplot).
Arguments
- x
is a cord object, e.g. from output of
cord- biplot
TRUEif both latent variables and their coefficients are plotted,FALSEif only latent variables- site.col
site number colour (default is black), vector of length equal to the number of sites
- sp.col
species name colour (default is blue), vector of length equal to the number of sites (if arrow=TRUE)
- alpha
scaling factor for ratio of scores to loadings (default is 0.7)
- arrow
should arrows be plotted for species loadings (default is TRUE)
- site.text
should sites be labeled by row names of data (default is FALSE, points are drawn)
- labels
the labels for sites and species (for biplots only) (default is data labels)
- ...
other parameters to be passed through to plotting functions.
Examples
X <- spider$x
abund <- spider$abund
spider_mod <- stackedsdm(abund,~1, data = X, ncores=2)
spid_lv=cord(spider_mod)
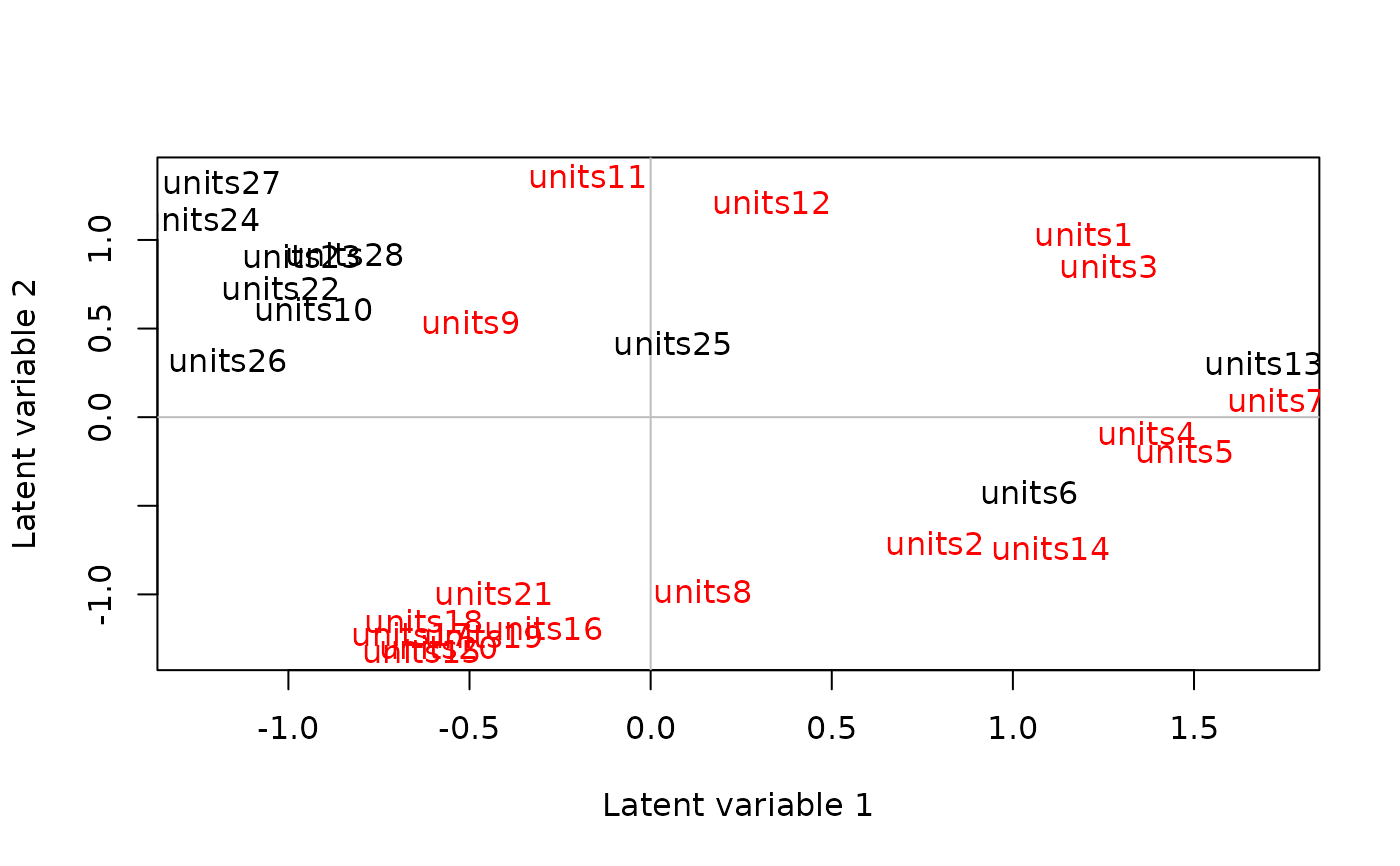
#colour sites according to second column of x (bare sand)
cols=ifelse(spider$x[,2]>0,"black","red")
plot(spid_lv,biplot = FALSE,site.col=cols, site.text = TRUE)
 # \donttest{
library(ggplot2)
library(RColorBrewer)
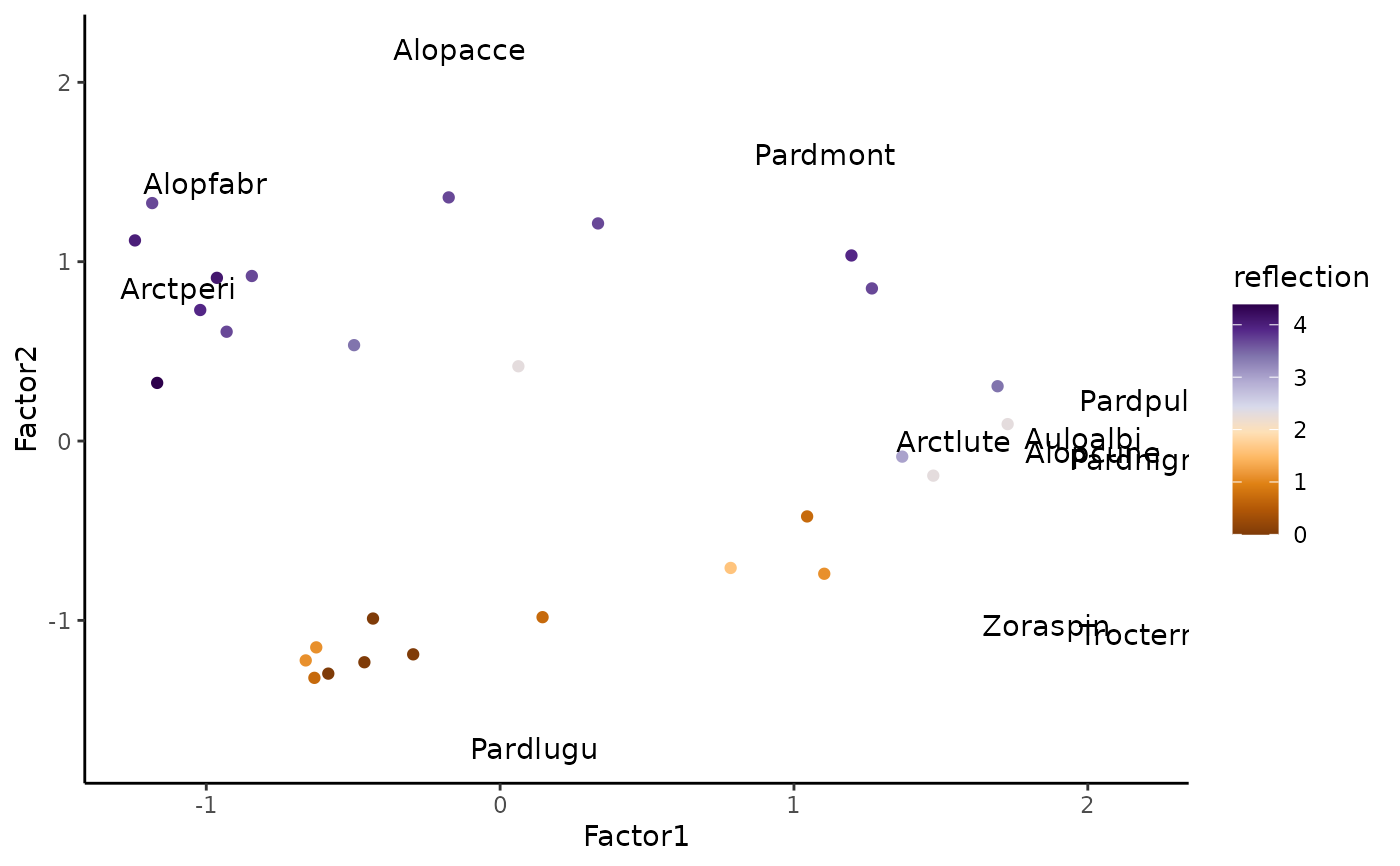
alpha= 2.5
site_res <- data.frame(spid_lv$scores,X)
sp_res <- data.frame(spid_lv$loadings,species=colnames(abund))
ggplot()+
geom_point(aes(x=Factor1,y=Factor2,color = reflection ),site_res)+
geom_text(aes(x = Factor1*alpha, y = Factor2*alpha,label = species),data=sp_res)+
scale_color_gradientn(colours = brewer.pal(n = 10, name = "PuOr"))+
theme_classic()
# \donttest{
library(ggplot2)
library(RColorBrewer)
alpha= 2.5
site_res <- data.frame(spid_lv$scores,X)
sp_res <- data.frame(spid_lv$loadings,species=colnames(abund))
ggplot()+
geom_point(aes(x=Factor1,y=Factor2,color = reflection ),site_res)+
geom_text(aes(x = Factor1*alpha, y = Factor2*alpha,label = species),data=sp_res)+
scale_color_gradientn(colours = brewer.pal(n = 10, name = "PuOr"))+
theme_classic()
 # }
# }